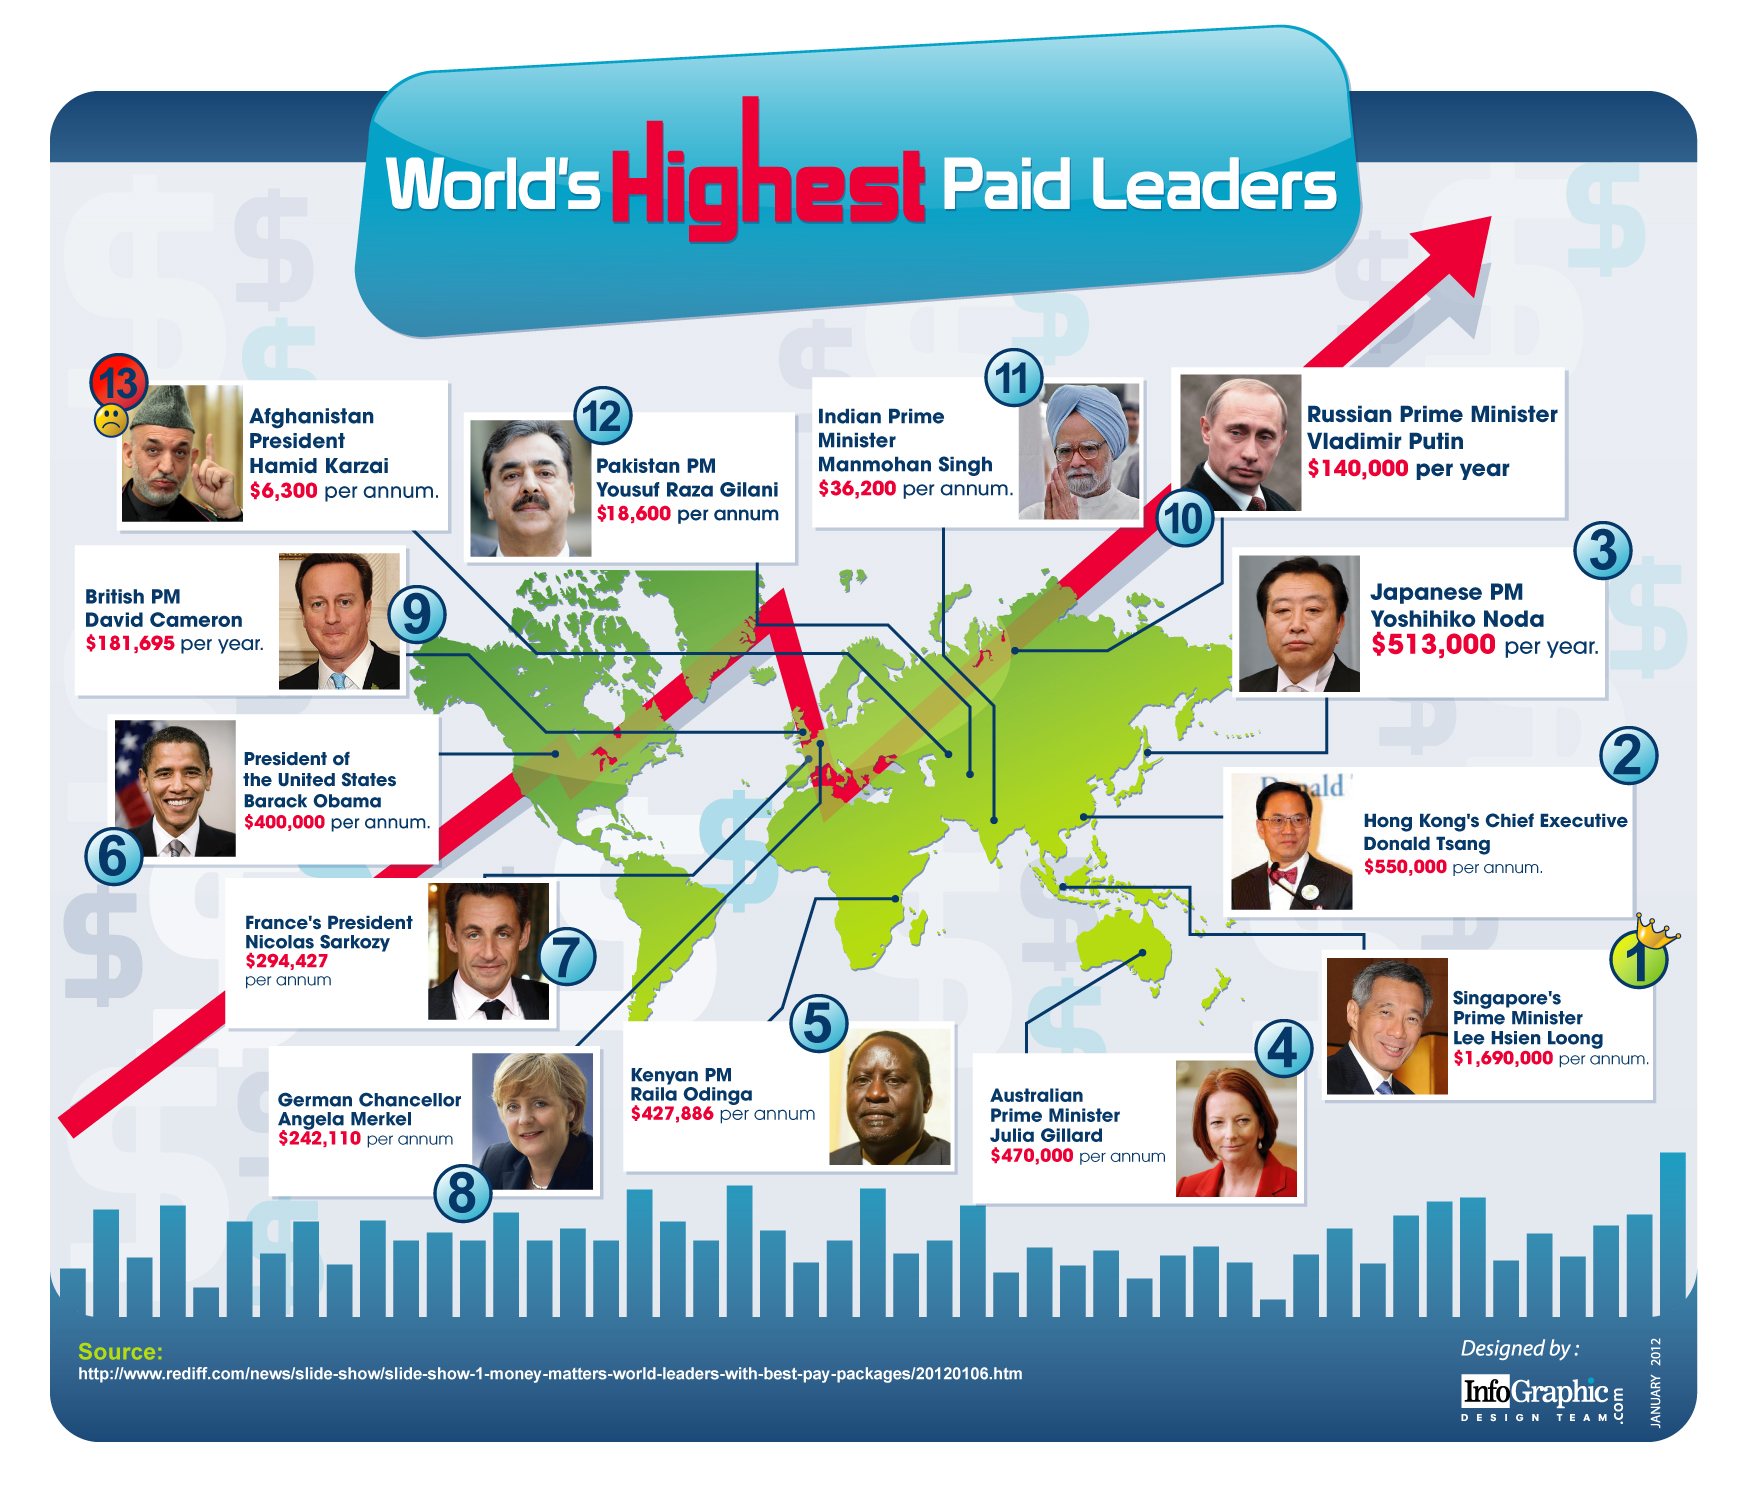
Infographic: Race for White House

The US election which is going to be held on 6 November,2012.Not only people of US, but also people all over the world anxiously waiting for the this election. Who is going to rule the US for next four years. Is it the sometime much acclaimed or sometime criticized the present US president Barack Obama or someone other than Obama. US economy is in hole, and no one knows how to climb out of it. So whoever will be elected a he have to confront the dwindling economy, huge unemployment problem through which US is passing through. With this election future of other nation is also related. So the US election 2012 definitely going to be a political extravaganza of this century. Check out this Infographic Race for the White House, designed by InfoGraphic Design Team to know more about US election Presidential candidates.


Infographic: Race for White House


Why America’s Education Isn’t Worth the Money

America spends a lot of money on education, and the announcement of the 2013 budget plan is no exception. With a projected $1.7 billion increase from last year’s education spending plan, the U.S. government will continue to have the priciest school spending on the globe, outranking every other country in price-per-student costs. From specialized classes for lagging students to sophisticated technology in kindergarten classes, the U.S. government is committed to spending whatever it takes to give kids a top-notch education.

But despite this spending, American students just don’t seem to be measuring up. Outscored by nations who spend far less, public school students in the U.S. don’t seem to be making any headway. Test scores, graduation rates, and general student achievement have all stagnated in America since the 1970s, and ACT scores have begun to decline. So when American students fail to achieve year after year, the question arises: Exactly what is that money doing for America’s education?

Via

Why America's Education Isn't Worth the Money


Infographic: What is Quantitative Easing?

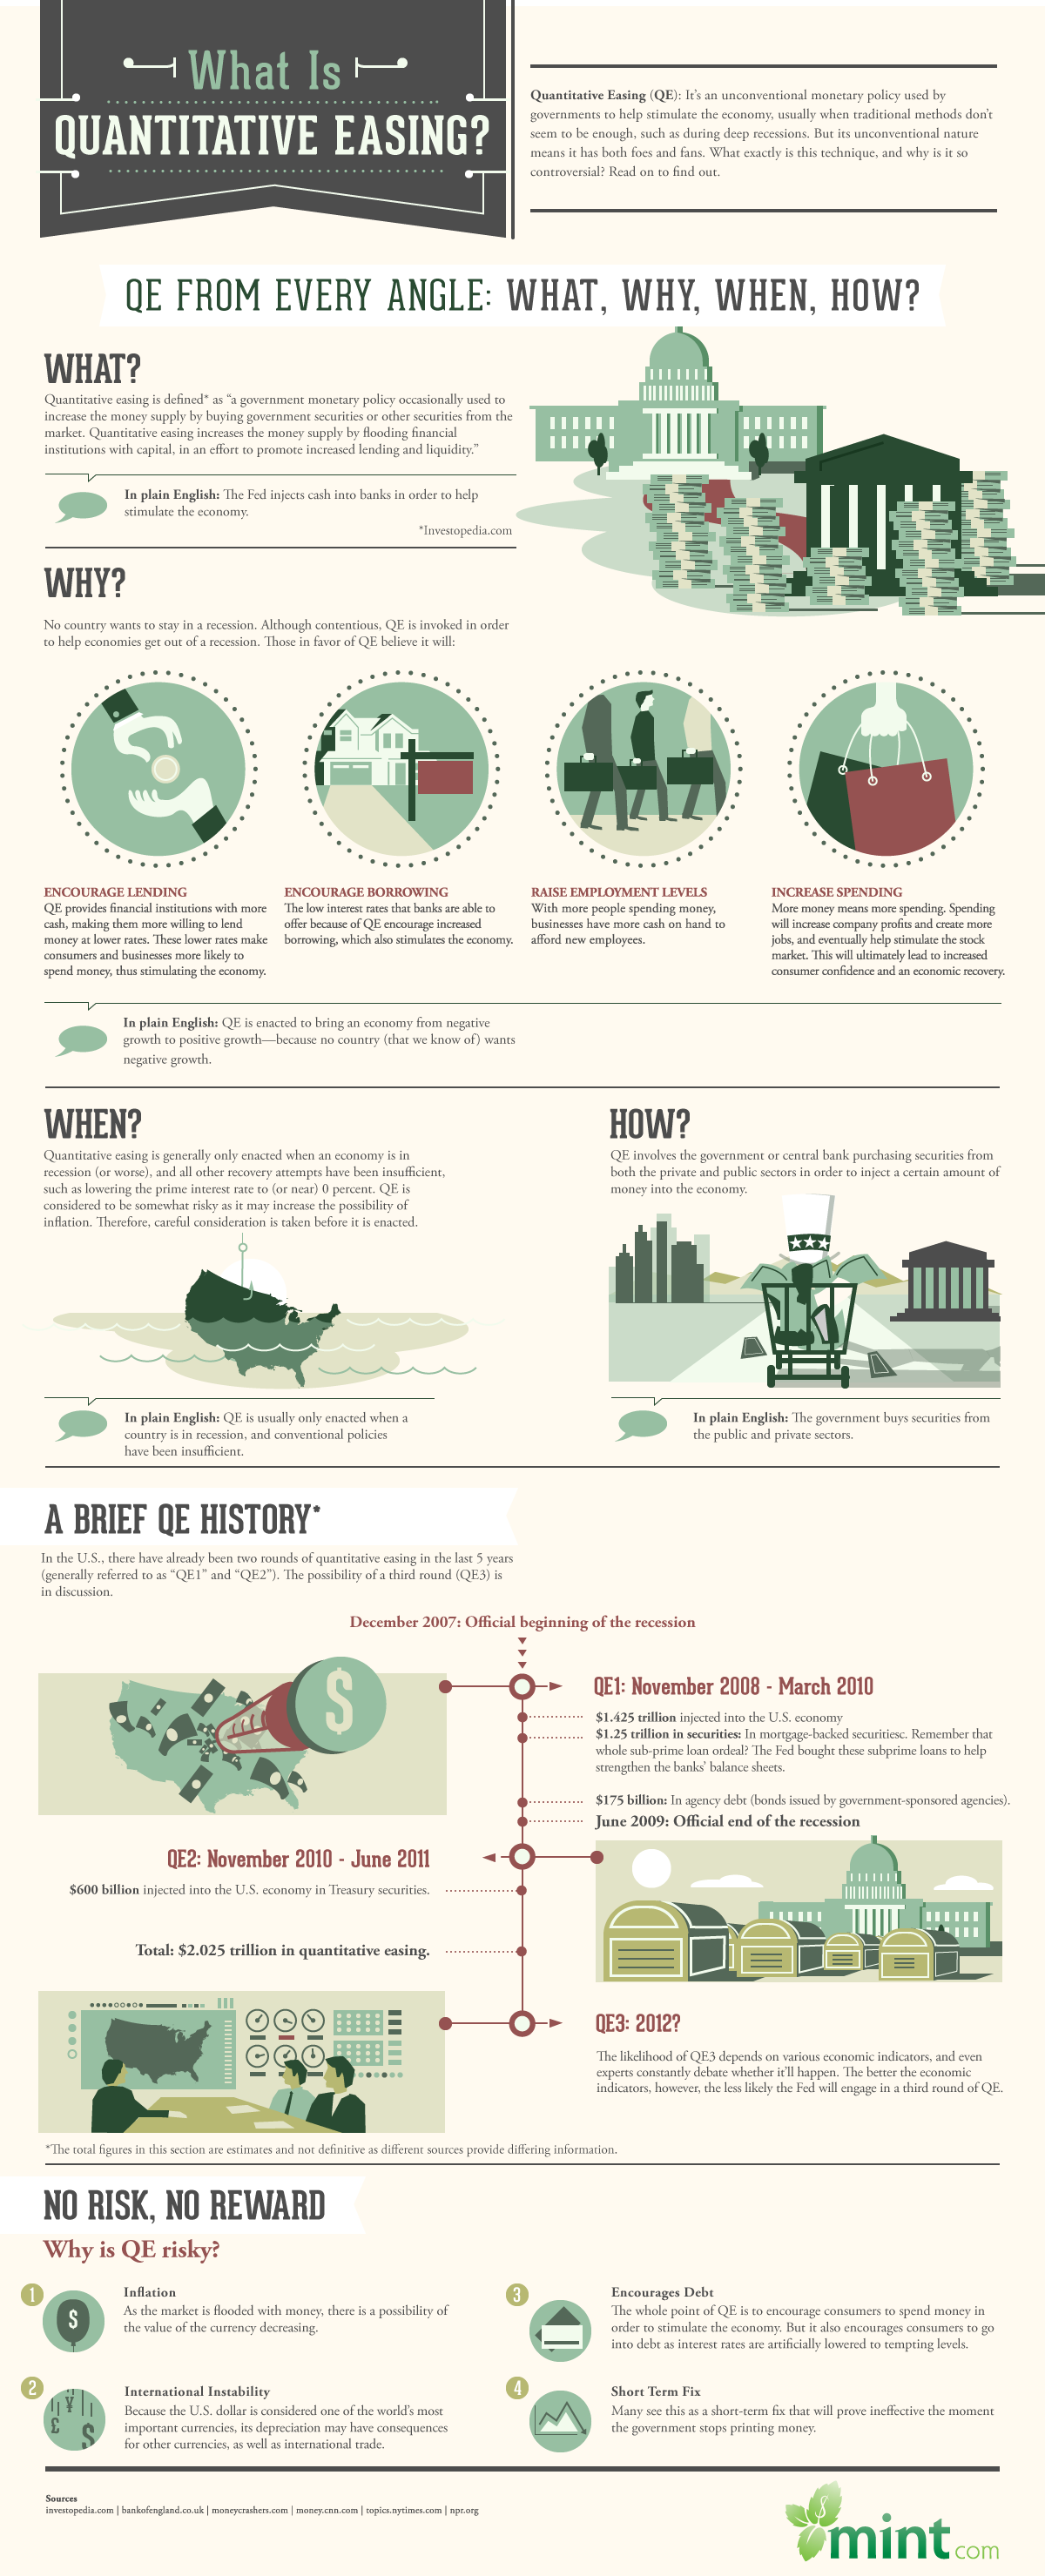
When traditional methods used to stimulate the economy don’t work, what do governments do?

Quantitive easing, defined as “a government monetary policy occasionally used to increase the money supply by buying government securities or other securities from the market,” is often used to increase the money supply and promote lending and liquidity. Fan or foe, it’s an unconventional monetary policy used during deep recessions.

Via

Infographic: What is Quantitative Easing?


Presidential Candidates And Their Tax Proposals – Infographic

As is with all Presidential elections in the United States, taxes are again central to the political discussion around who will be the best man to lead our nation. Will it be President Obama for a second term? Or will the stable of Republican challengers win the day? We don’t have a crystal ball here but what we do have is The Tax Institute at H&R Block.

The big brains over at The Tax Institute have been hard at work crunching the numbers associated with the various candidates tax plans. Below is a great data visualization, or infographic, on what each candidate is proposing and what it means for you and your family.

Fresh on the heels of the Iowa Caucus, and this week’s New Hampshire primary, some candidates have dropped out while others are hanging on for dear life. The candidates represented in our graphic are still in the race and have presented an idea of what tax policy they would pursue as President.


Courtesy:- blogs.hrblock.com