Infographic : 31 Million on unemployment benefits

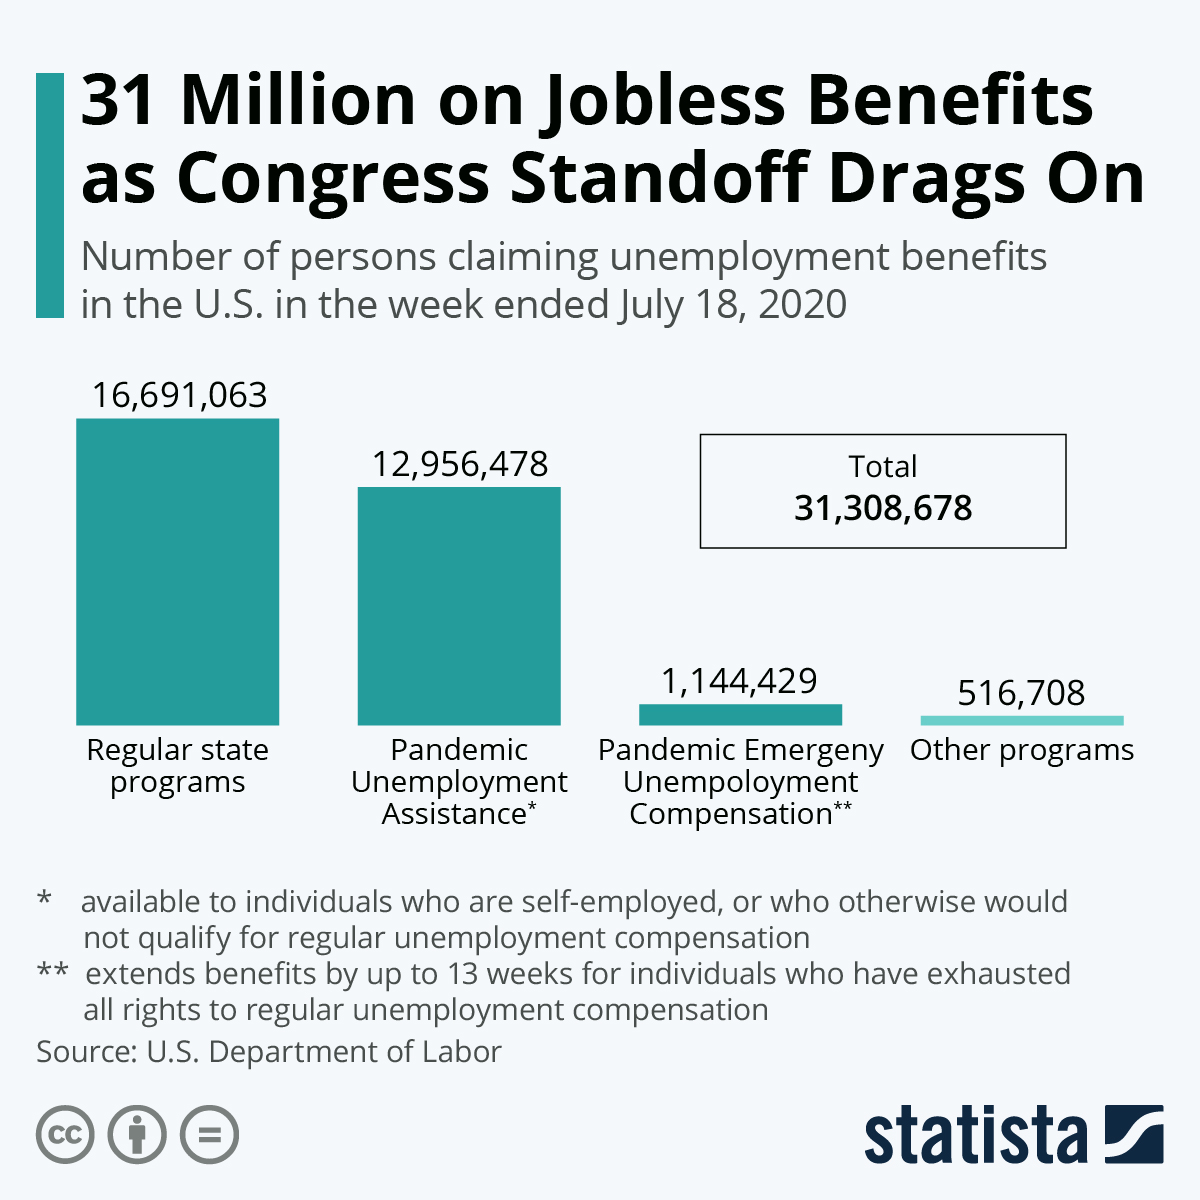
Roughly 30 million Americans continue to fear for their livelihood as Congress has yet to find a compromise on extending the weekly supplement to regular unemployment benefits that expired at the end of July. As part of the CARES Act, the Federal Pandemic Unemployment Compensation program (FPUC), which provided an additional $600 per week to individuals collecting regular jobless benefits, has proven highly effective in keeping affected households afloat during the past few months, and it is widely feared that millions of laid-off workers will no longer be able to pay their bills or serve their debt without the weekly supplement.

According to data published by the U.S. Department of Labour on Thursday, more than 30 million Americans received unemployment benefits in the week ended July 18, 16.7 million through regular state programs and another 13 million through the federal Pandemic Unemployment Assistance program, which is available to individuals who are self-employed or who otherwise would not qualify for regular unemployment compensation. As the majority of those 30+ million previously qualified for the weekly $600 bonus, economists are warning that consumer spending could fall off a cliff in case Congress fails to agree on an adequate follow-up aid package.

Infographic Source :- https://www.statista.com
Infographic : 31 Million on  unemployment benefits

Infographic : Mutual Funds Disadvantages

While low risk mutual funds are an important part of many asset management strategies, they are not a panacea for investors. Every successful portfolio has the intention of using the best mutual fund they can find to meet the investor’s global tactical asset allocation strategy for diversification and to maximize returns. This Infographic edition of lowriskmutualfunds.net investment management blog addresses the disadvantages of mutual funds.

Infographic: Mutual Funds Disadvantages


Infographic : The 7 Types of Millennials

What is a millennial?

If you are one of the 80 million people in the United States born between 1982 and 2000, welcome to the most diverse generation the country has ever seen.

The following infographic explores the 7 types of millennials you might identify with.

Which one are you?

Via :- mint.com

Infographic : The 7 Types of Millennials


Infographic: 80 Years of Financial (de)Regulation in the U.S.

Since the Great Depression in 1929, the U.S. has experienced an assortment of financial catastrophes and victories. How the nation has responded to these events has shaped the financial regulation landscape into what it is today.

The following infographic breaks down the last 80 years of U.S. regulation and deregulation and highlights the industries most affected by the various events.

Via

Infographic: 80 Years of Financial (de)Regulation in the U.S.


Higher Education: Economic Boon or Bubble?

With the economic downturn of recent years, many Americans are wondering if a college degree is the answer to their employment woes.

If they return to school, will the cost of tuition, books and other school expenses pay off in the end? To answer that question, you have to look at the volume of students, volume of college debt and the resulting employment and earnings figures.

Via

Higher Education: Economic Boon or Bubble?