Infographic : The Best Employers for Women 2020

Even though progress has been made in narrowing the gender gap in U.S. workplaces, the pay gap remains much more pronounced than commonly assumed. In late 2018, the Washington-based Institute for Women’s Policy Research said that women are earning just 49 cents to the typical man’s dollar which is much less than the 80 cents normally reported. Some organizations are bucking the gender discrimination trend, however, something which prompted Statista and Forbes to team up to identify America’s Best Employers for Women.

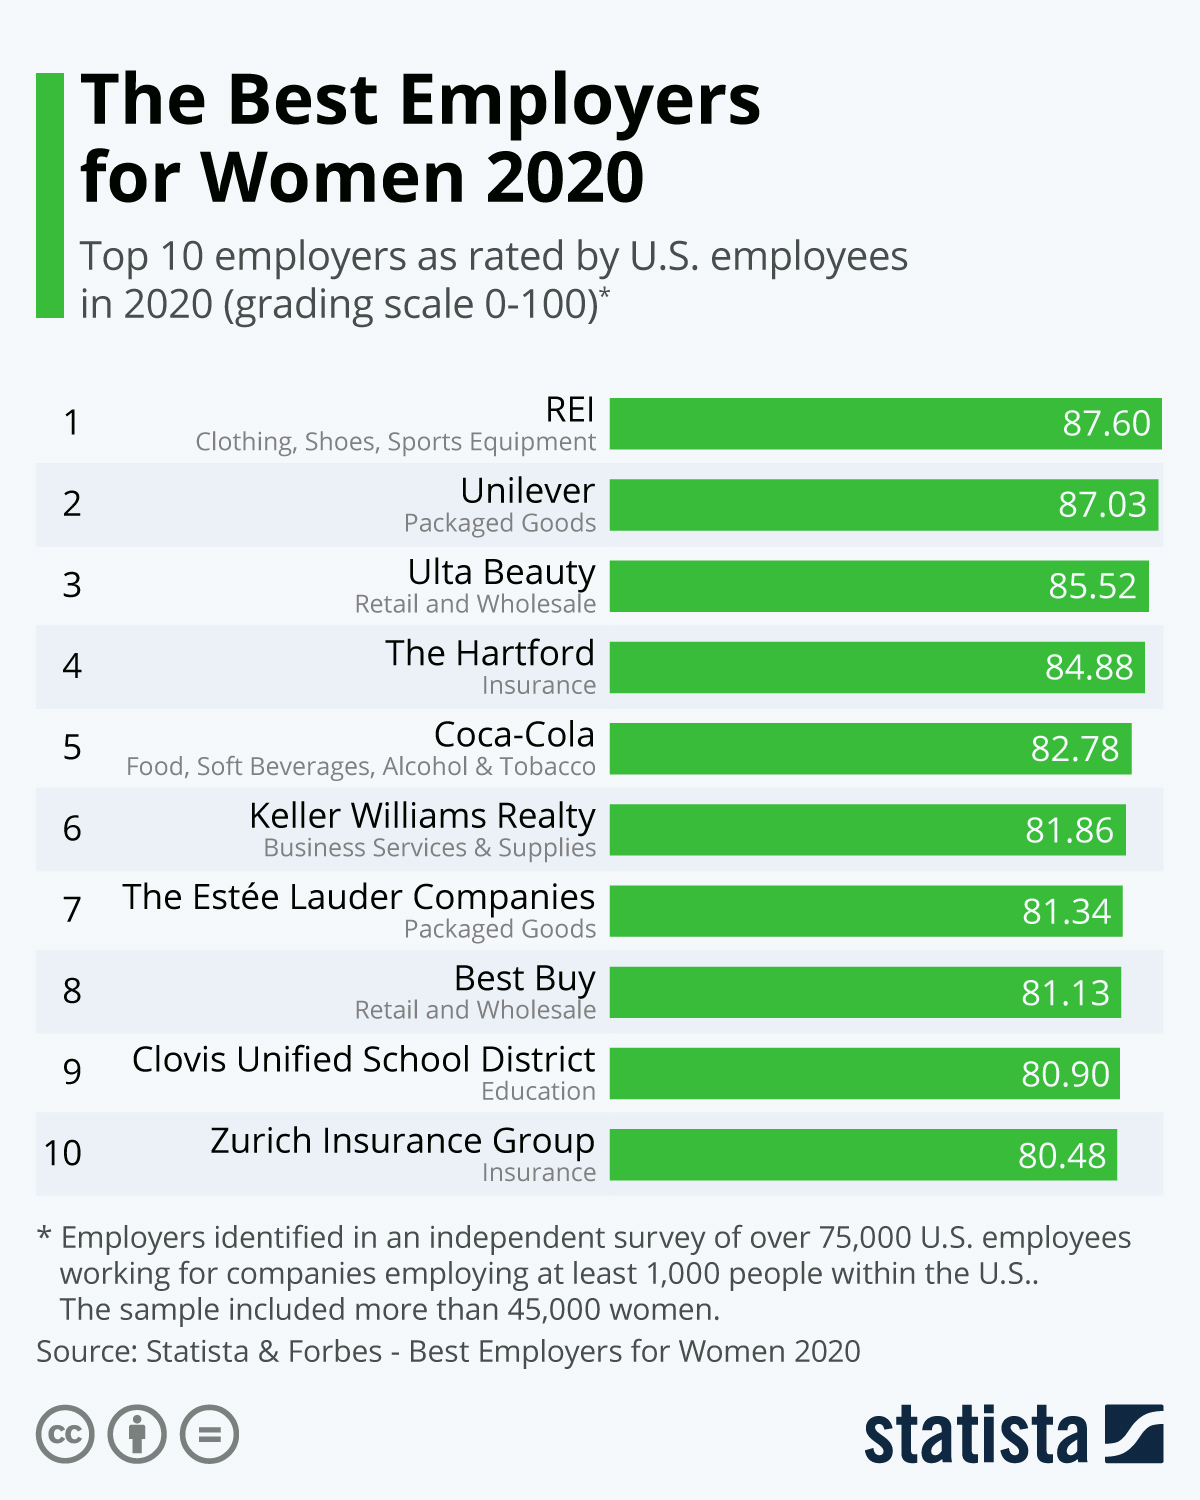
The 2020 list was compiled by surveying over 75,000 U.S. employees working for companies employing at least 1,000 people in their U.S. operations with 45,000 women included in the sample. Four criteria were involved in the evaluation – direct recommendations in terms of general work topics, direct recommendations relevant for women, indirect recommendations as well as diversity levels among top executives or the board. The 300 companies receiving the highest total scores were awarded as the Best Employers for Women 2020. It is also important to mention that the research was conducted during March and April 2020, when Covid-19 was spreading across the country and the responses reflect employee’s feelings just before the crisis really took hold.

This year, sporting goods retailer REI jumped 20 places to take top spot with a score of 87.6. The company states that it is devoted to the promotion of diversity, equality and inclusion with women making up 38 percent of its board of directors, half its senior leadership and 45 percent of its total workforce. Additionally, REI has been working over the past three years to dissolve gender labels in outdoor gear and it has funded inclusion efforts, donating $2.5 million to 80 organizations. Unilever comes second in this year’s ranking with 87.93 while beauty chain Ultra Beauty rounds off the top-three with 85.52. You can browse the full list on Forbes here.

Infographic Source :- www.statista.com

Infographic : The Best Employers for Women 2020

Infographic : Linkedin Success Story

LinkedIn is a popular networking site across the world. The company earns a revenue of almost US$ 6.8 billion, and has 20,500 employees. It has a strong customer base in more than 200 countries. Linkedin’s unique success story can be seen in this interactive infographic from InfoClutch and how Linkedin became the world’s biggest professional network.

Infographic Source :- https://www.infoclutch.com

Infographic : Linkedin Success Story

How Bid Search Services Can Help Your Business

Did you know that bid search services help to win businesses millions of pounds in additional work and revenue? This infographic shows you how the bid search service industry functions in the simplest terms, and how they are able to serve a wide range of sectors and clients.

Bid search services specifically seek the best business opportunities and open tenders for their clients. They then assist them by preparing and submitting the most effective applications.

Through a simple and engaging flow chart style, the infographic shows how the best bid search service professionals achieve success for their clients — from sourcing the best opportunities, narrowing down the choices, and submitting the final bid.

Businesses across a range of industries use bid search services to help them win millions in additional revenue through successfully applying for the best open tenders.

The infographic shows in an accessible and engaging way how the process works, and how it can be used to benefit any business.

Infographic Source: https://www.bidandtendersupport.co.uk/


Infographic : How Accounting Software Helps Business?

Why is accounting software useful? More and more organizations are switching to an accounting solution to handle their financials; hence, there must be a good amount of beneficial reasons why. If you’re considering implementing this system to your business, one of the primary aspects to look into is determining the ways it can help with your accounting and bookkeeping tasks. Here’s the infographic of why accounting software is useful for business of any size.

Inographic Source – www.infoclutch.com

Infographic : How Accounting Software Helps Business?

Infographic : How The Second Youngest Billionaire In The World Started

This is the journey of OYO Rooms founder Ritesh Agarwal. Recently, he was listed in the Huran Global Rich List 2020 as the second youngest billionaire in the world, just after Kylie Jenner. At just age 26, his net worth is $1.1 billion. OYO is the competitor of Airbnb, and it is one of the largest hotel chains in the world.

Infographic : How The Second Youngest Billionaire In The World Started

Infographic : The 7 Types of Millennials

What is a millennial?

If you are one of the 80 million people in the United States born between 1982 and 2000, welcome to the most diverse generation the country has ever seen.

The following infographic explores the 7 types of millennials you might identify with.

Which one are you?

Via :- mint.com

Infographic : The 7 Types of Millennials


Infographic : Timeline of Mobile Marketing

Mobile technology has advanced by leaps and bounds.  From the advent of cell phones to the ability to deposit checks and send payments on your phone, our world is increasingly becoming mobile-driven.  www.topmarketingschools.net has created an infographic entitled “Mobile Marketing: No Longer a Spam and Pop-Up World” cataloging the innovations and enhancements of mobile technology, along with the critical role of mobile marketing in an ever increasing on-the-go world.


Infographic : Timeline of Mobile Marketing


Infographic: 80 Years of Financial (de)Regulation in the U.S.

Since the Great Depression in 1929, the U.S. has experienced an assortment of financial catastrophes and victories. How the nation has responded to these events has shaped the financial regulation landscape into what it is today.

The following infographic breaks down the last 80 years of U.S. regulation and deregulation and highlights the industries most affected by the various events.

Via

Infographic: 80 Years of Financial (de)Regulation in the U.S.


Brand Value Creation

In the 21st century’s globalized market Brand value is the main USP  of a product that work as a catalyst for conquering the greatest market share compare to its competitor.

Brand value means the capacity of the brand name to attract and sustain the consumers  and make them go for the products only by viewing the brand name surpassing  other ingredients. Brand value has to be created and some factors play important role in creating brand value.
Brand value creation is a long term task, it takes time to make customer awareness by communicating brand message and creating customer loyalty by delivering consistently good quality product.

This infographic on Brand  Value creation emphasizes on the factors that remains behind the brand value creation. This infographic designed by InfoGraphic Designed Team will defiantly prove useful for common people and also for those business barons who want to promote his brand.

Brand Value Creation