Infographic : 31 Million on unemployment benefits

Roughly 30 million Americans continue to fear for their livelihood as Congress has yet to find a compromise on extending the weekly supplement to regular unemployment benefits that expired at the end of July. As part of the CARES Act, the Federal Pandemic Unemployment Compensation program (FPUC), which provided an additional $600 per week to individuals collecting regular jobless benefits, has proven highly effective in keeping affected households afloat during the past few months, and it is widely feared that millions of laid-off workers will no longer be able to pay their bills or serve their debt without the weekly supplement.

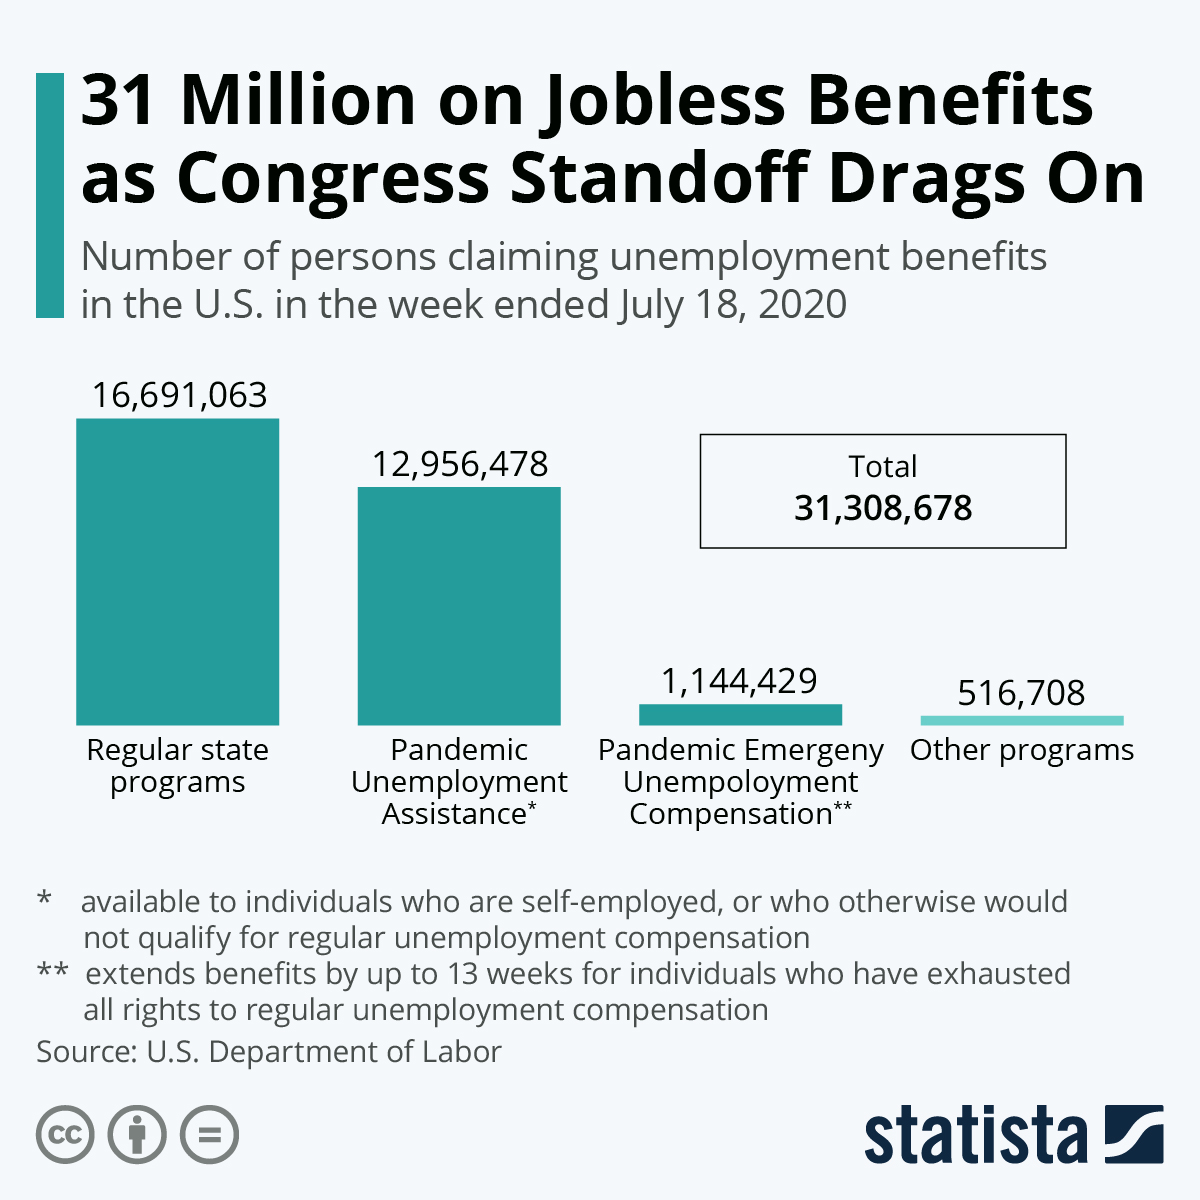
According to data published by the U.S. Department of Labour on Thursday, more than 30 million Americans received unemployment benefits in the week ended July 18, 16.7 million through regular state programs and another 13 million through the federal Pandemic Unemployment Assistance program, which is available to individuals who are self-employed or who otherwise would not qualify for regular unemployment compensation. As the majority of those 30+ million previously qualified for the weekly $600 bonus, economists are warning that consumer spending could fall off a cliff in case Congress fails to agree on an adequate follow-up aid package.

Infographic Source :- https://www.statista.com

Infographic : 31 Million on  unemployment benefits

Infographic : Why It Pays to Be Single

It can be hard being single, especially when Valentine’s Day rolls around, and you see others celebrating their relationships. It’s equally difficult when TV shows and movies portray relationships as the gold standard that everyone should strive for. 

The truth is that being a party of one comes with plenty of benefits. You have more time to figure out who you are and who you want to be. Spontaneity comes easily because you don’t have to consider what your partner wants. You may even pick up an interesting new hobby. 

One of the best benefits of being single is the opportunity to whip your finances into shape and save a ton of money! For example, consider your monthly grocery budget. The United States Department of Agriculture estimates that the monthly cost of groceries for women under 50 is about $256. For men under 50, it’s about $302. Meanwhile, the monthly grocery cost for families of two is about $613. 

Let’s do some quick math. That means each partner winds up paying about $307 per month. That’s $51 more than a single woman would pay for groceries each month and $5 more per month for men. (That’s not to mention that, if you’re single, you’ll likely spend a lot less on going out for food!) 

Additionally, if you’re not in a relationship, you can live simply, take up a side hustle, and even qualify for more financial aid than you would if you had a partner.

Infographic Source:- mint.com

Infographic : Why It Pays to Be Single


Peer-to-Peer Renting: Embrace the Adventure

There’s a new shift in today’s rental market. It’s a new culture based on peer-to-peer (P2P) sharing.

A ‘sharing economy’ or ‘collaborative consumption’ is a popular economic model that is transforming the rental market.

  • Renters save money; owners make money; and properties beat standard hotels and rental agency locations.
  • It’s the same economic principle based on Uber.
  • The peer-to-peer rental market is valued at around $26 billion.

Infographic created by ralarm.com

Peer-to-Peer Renting: Embrace the Adventure

Peer-to-Peer Renting: Embrace the Adventure


Infographic : Mutual Funds Disadvantages

While low risk mutual funds are an important part of many asset management strategies, they are not a panacea for investors. Every successful portfolio has the intention of using the best mutual fund they can find to meet the investor’s global tactical asset allocation strategy for diversification and to maximize returns. This Infographic edition of lowriskmutualfunds.net investment management blog addresses the disadvantages of mutual funds.

Infographic: Mutual Funds Disadvantages


Infographic : Investment Opportunities Projections for 2014

Online Trading Academy, a leading source for investor training has come up a list of what’s hot and what’s not for investment opportunities for 2014. The trading academy has 34 financial educational centers all over the world and they also have a full online curriculum. The investment opportunity forecast for 2014 are from some of their top traders. Take a look at the infographic below from the Online Trading Academy.

Infographic : Investment Opportunities Projections for 2014


Infographic : The 7 Types of Millennials

What is a millennial?

If you are one of the 80 million people in the United States born between 1982 and 2000, welcome to the most diverse generation the country has ever seen.

The following infographic explores the 7 types of millennials you might identify with.

Which one are you?

Via :- mint.com

Infographic : The 7 Types of Millennials


Infographic: What Should You Do with $25,000?

Maybe you didn’t hit the mega-millions jackpot, but you’ve come into some extra cash. It might be tempting to go out and indulge, but there is probably a better way to spend that money.

In the final installment of this 3-part series, Jennifer Openshaw, America’s Chief Consumer Advocate, Wall Street Journal columnist and CEO of Family Financial Network, is back with advice on what to do with $25,000.

From purchasing an income property to deciding which upgrades to make on your primary residence, see what she says about how to make sure your financial decisions have a positive impact on your long-term financial well-being.

If you are just catching up on the series, check out Jennifer’s infographics on what you should do with $1,000 and what you should do with $10,000. The ideas range anywhere from building an investment portfolio to purchasing a new set of wheels — even getting certified in yoga instruction.

Via

Infographic: What Should You Do with $25,000?