WordPress the Emerging Monopoly in CMS (Infographic)

By March 2012, with about 72.4 million users for the content management system, the WordPress (WP) grew as the largest of its type on the planet.It provided hosting to more than 50% of the CMS users and more than 45% of the top 100 sites as rated by Technorati use WP services.

The CMS grew by a great rate after the release of the version 3.3 and people seem reluctant to switch to 3.4. On average, the WP receives around 500,000 posts. Out of every 100 new domains created, 22 in the US belong to WordPress. WP boasts of 3 million searches worldwide per month and Indonesians are the best promoters and users of the WP services and it ranks 8th in that country.

In a month, on average, around 352 m people view more than 2.5 m pages in an average month. A survey of 18,000 users by Word press foundation found that the median rate of a Word press project to be $50 p/h. Of the 19,000+ plug-ins, SEO tops the list of downloaded with 20% followed by stats and images which account for 11 and 9 percent respectively.

Via

WordPress the Emerging Monopoly in CMS (Infographic)


Infographic: What Should You Do with $1,000?

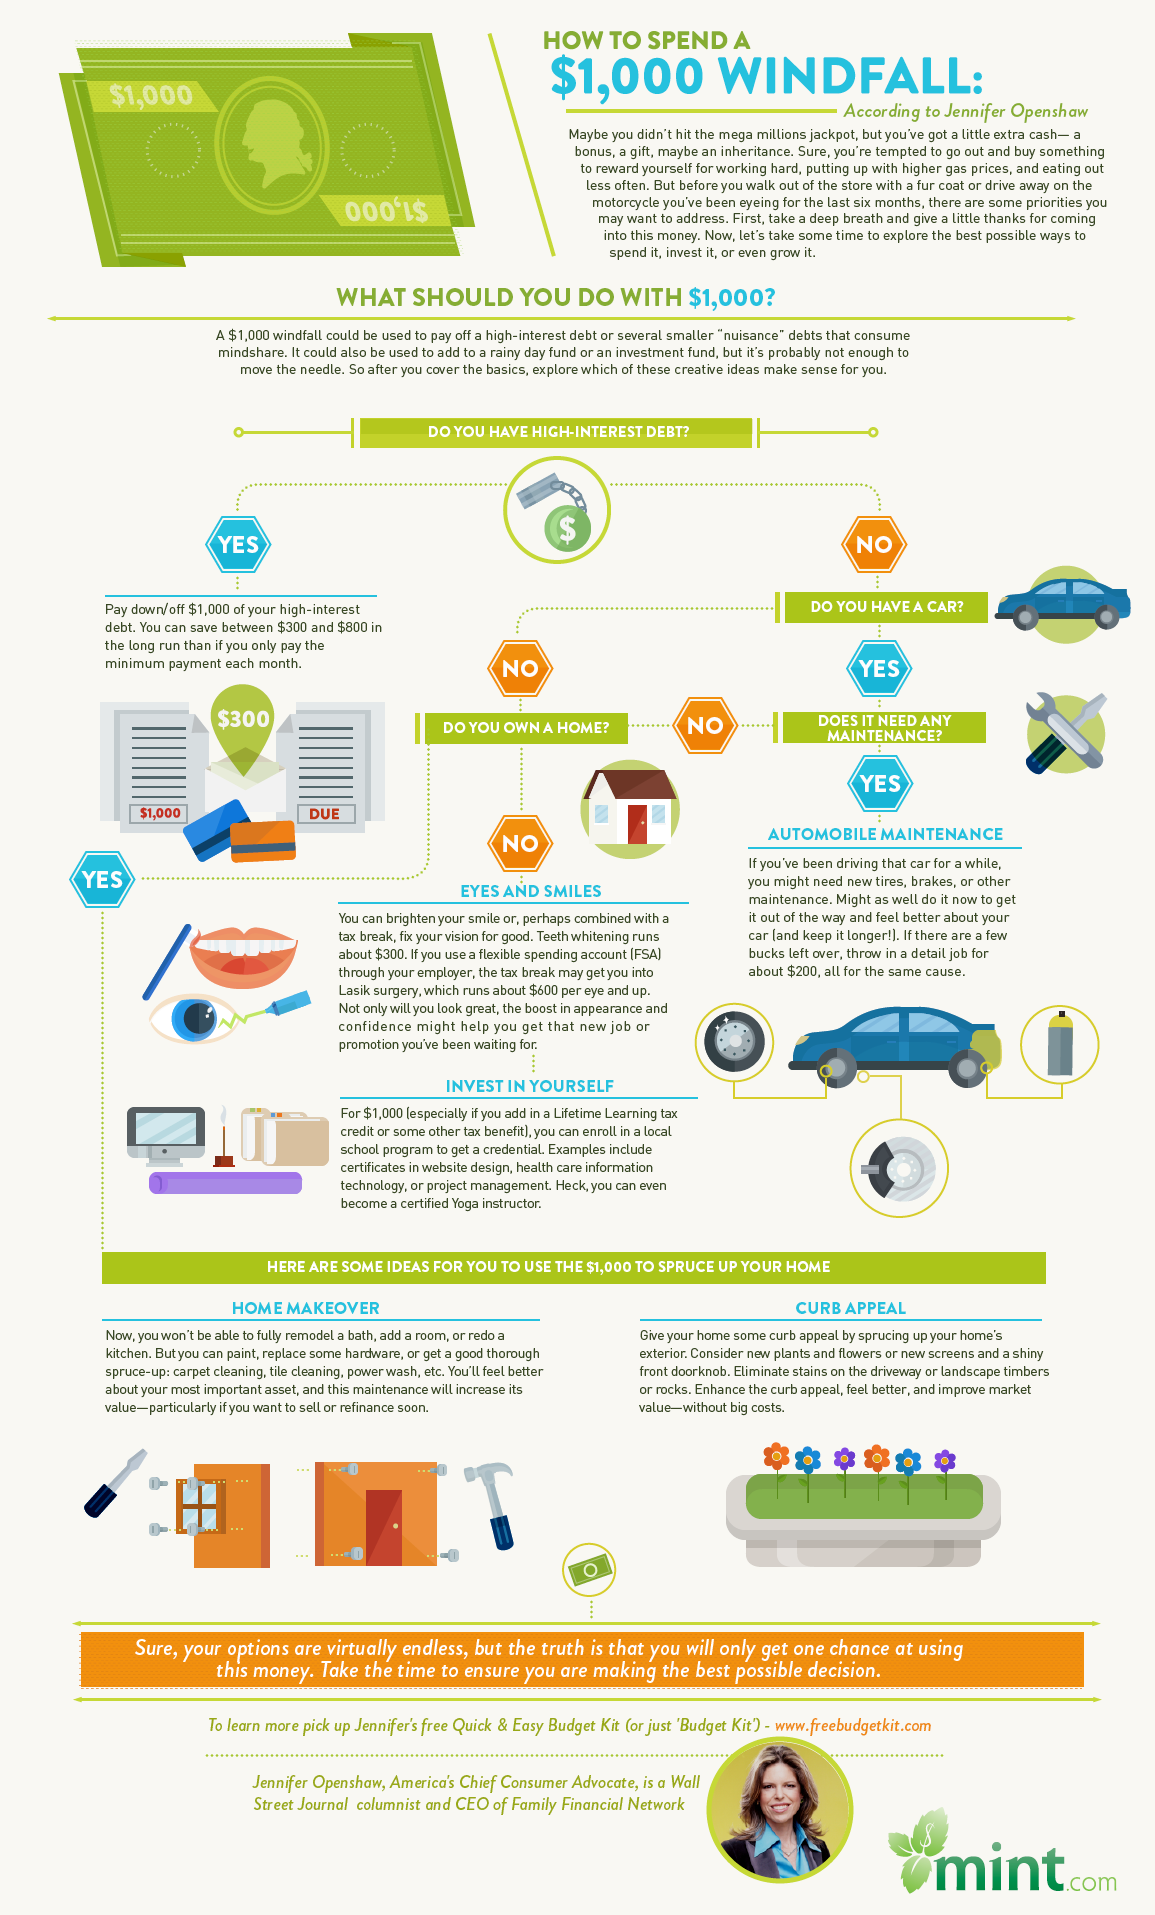
Maybe you didn’t hit the mega millions jackpot, but you’ve come into a little extra cash — a bonus, gift, or even a small inheritance.

Sure, $1,000 might be a relatively small amount of money and it’s tempting to go out and splurge on an indulgence, but what if there is a better way to spend that money?

Jennifer Openshaw, America’s Chief Consumer Advocate, Wall Street Journal columnist and CEO of Family Financial Network, is lending her expertise about what you should do with $1,000.

The following infographic explores the best way to spend $1,000 — whether you spend it, invest it, or even grow it.

Via

Infographic: What Should You Do with $1,000?


Infographic: 80 Years of Financial (de)Regulation in the U.S.

Since the Great Depression in 1929, the U.S. has experienced an assortment of financial catastrophes and victories. How the nation has responded to these events has shaped the financial regulation landscape into what it is today.

The following infographic breaks down the last 80 years of U.S. regulation and deregulation and highlights the industries most affected by the various events.

Via

Infographic: 80 Years of Financial (de)Regulation in the U.S.


Brand Value Creation

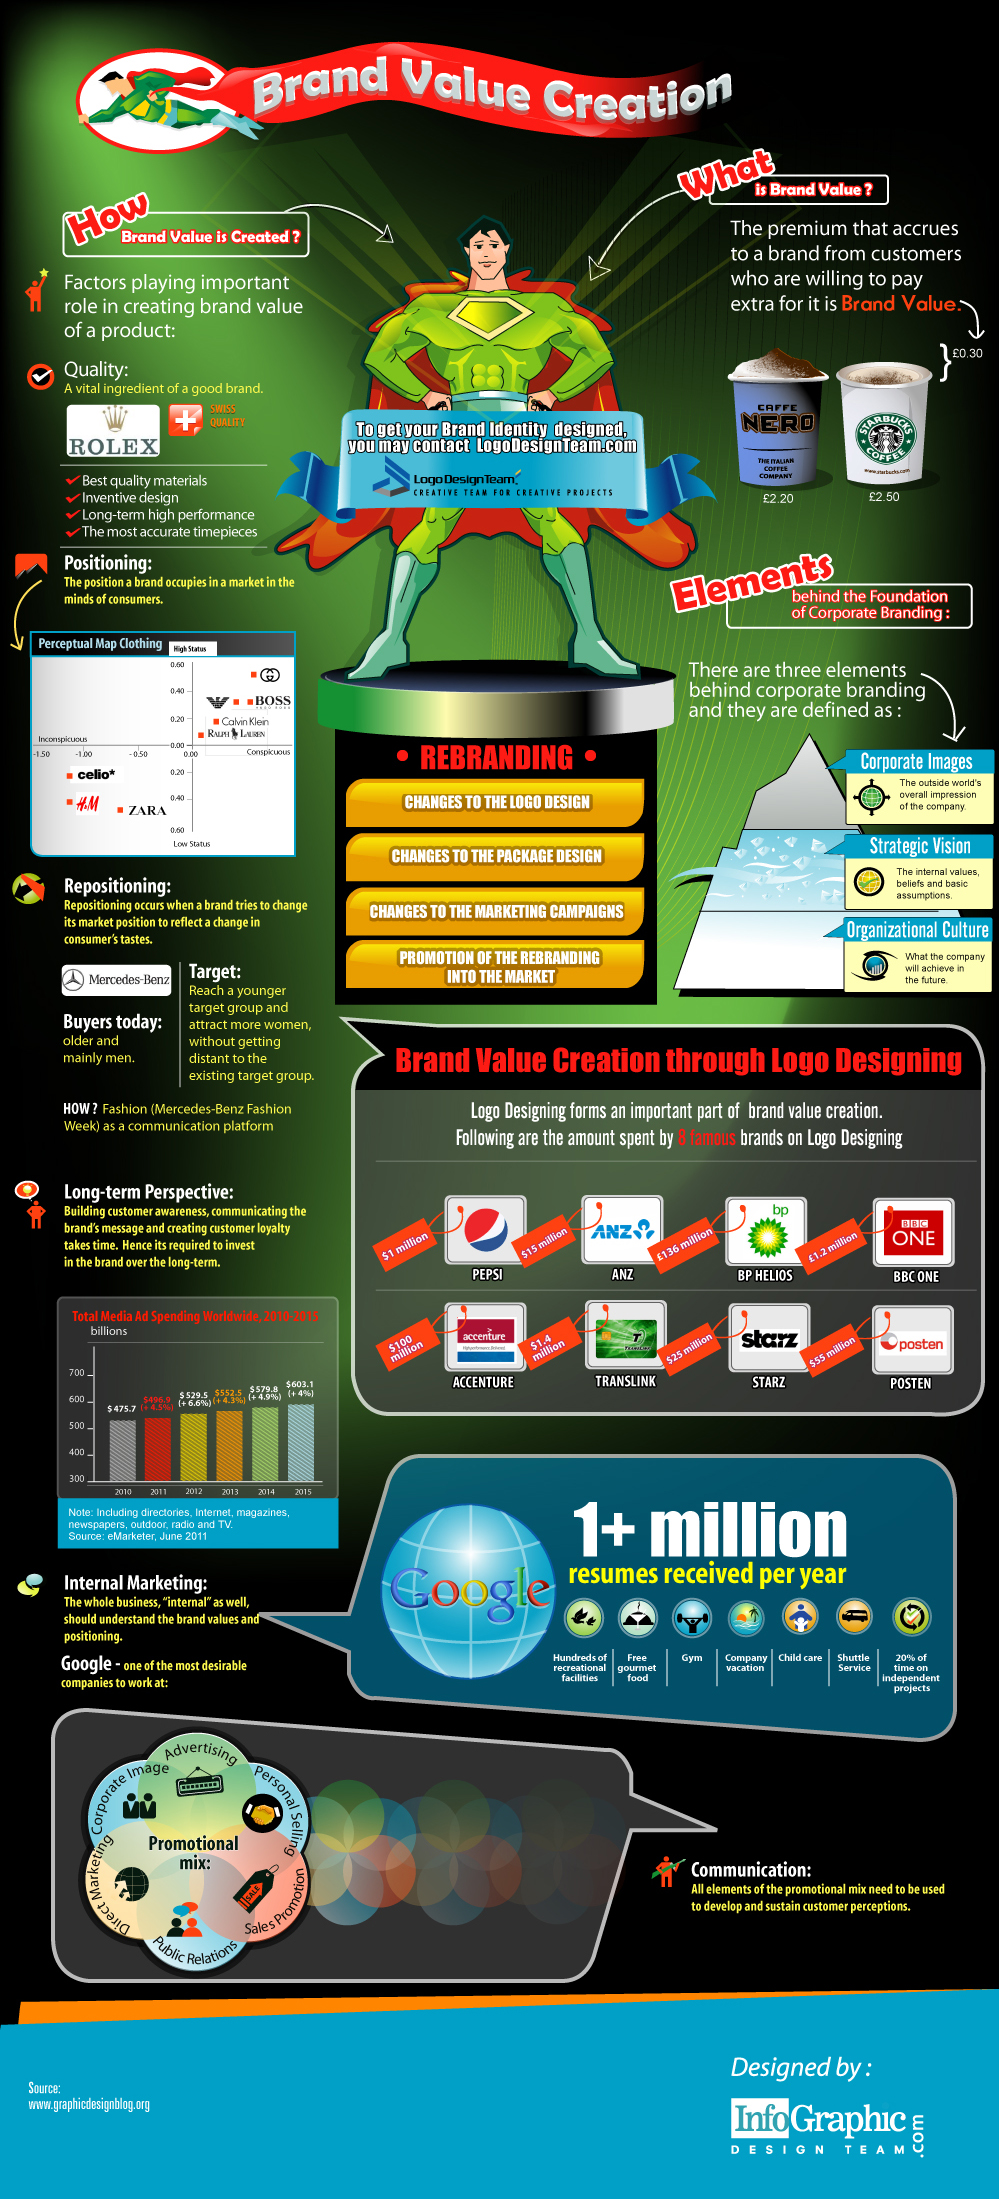
In the 21st century’s globalized market Brand value is the main USP  of a product that work as a catalyst for conquering the greatest market share compare to its competitor.

Brand value means the capacity of the brand name to attract and sustain the consumers  and make them go for the products only by viewing the brand name surpassing  other ingredients. Brand value has to be created and some factors play important role in creating brand value.
Brand value creation is a long term task, it takes time to make customer awareness by communicating brand message and creating customer loyalty by delivering consistently good quality product.

This infographic on Brand  Value creation emphasizes on the factors that remains behind the brand value creation. This infographic designed by InfoGraphic Designed Team will defiantly prove useful for common people and also for those business barons who want to promote his brand.

Brand Value Creation