
Month: November 2013
Infographic : Thanksgiving Spending in 2013
The trading academy has created an infographic about Thanksgiving in 2013. We all know the first Thanksgiving was a celebration of the first harvest in the new world that they shared. As the years have gone by more look at it as a time of overeating while watching football. There is definitely more to Thanksgiving than that. Check out the amazing facts and the associated costs that come with it.
Infographic Source :- www.tradingacademy.com

Infographic : 7 Steps to Selecting a Coworking Space
Uberoffices has created a 7 step guide on selecting a coworking space. A coworking space is a shared working enviroment that are usually individuals sharing work space that are not employed by the same organization. It is becoming more and more common for businesses to do this. So check out Uberoffices 7 step guide below to finding the perfect coworking space for your needs.

Infographic : SEO Experts on the Future of Marketing
Marketing is a twisted, winding road, with many dead ends. Website content, along with social network marketing, are two ways to ensure that you stay in tune with your customers. As soon as search engine optimization (SEO) is mentioned, however, many marketers run the other direction. With so much mis-information out there about SEO, what do you believe? www.pardot.com has created an infographic sourcing opinions from the top names in the business-giving you their insights, advice, and predictions about SEO and social network marketing.

Infographic : Difference Between Online and Offline Leads
No matter your market, sales leads come from two very important-but vastly different-sources. Online leads, or offline leads. While both of these lead streams are vital to the success of business, many businesses are handling these leads in a “One size fits all” manner. www.salesforce.com has created an infographic entitled “The Differences between Online, Offline Leads and How Each Impacts Lead Conversions” with easy to follow directions on how to correctly handle both types of leads.

Infographic : In Praise of Garage Sales
Every weekend, thousands of families sell their extra things right in their front yard. Whether you call it a moving sale, rummage sale, or yard sale-garage sales are a $2 billion a year business. www.

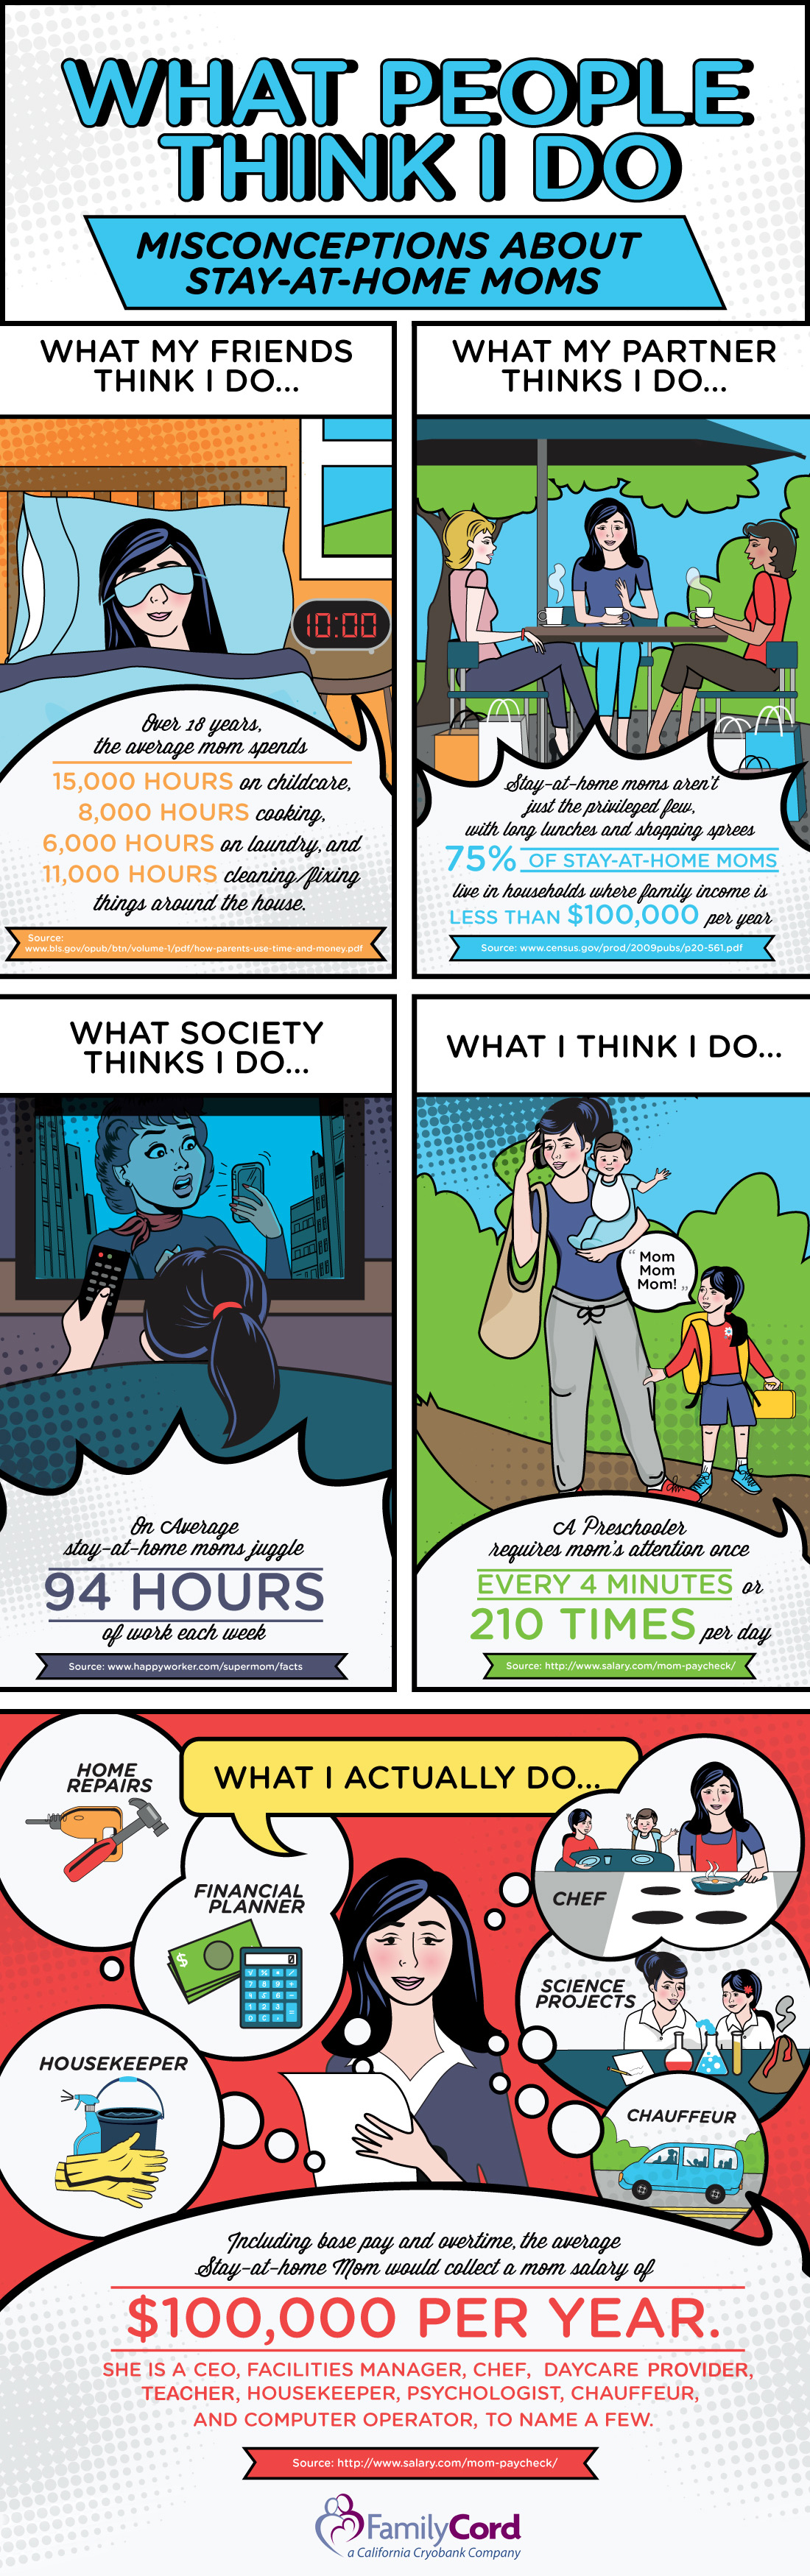
Infographic : What People Think I Do
Over an average year, a stay at home mom spends 15,000 hours on childcare, 8,000 hours on cooking, 6,000 hours on laundry, and 11,000 hours cleaning/fixing the house. This averages out to about 94 hours per week of work-hardly enough time to sit around all day watching soaps! And with a preschooler, sitting through an entire show is almost impossible. A preschooler requires a parent’s attention every 4 minutes on average-210 times a day. And shopping sprees are usually few and far between, since 75% of families that have a stay at home mom have less than $100,000 per year in income.
Infographic Source :- www.familycord.com
Infographic : Protect Your home This Holiday Season
Did you know that in the U.S., a home burglary happens every 14.6 seconds? That adds up to 2,000,000 reported home invasions each year. Are you willing to battle those odds without the proper home protection? And now, with the holiday season now here, it’s the perfect time for a burglar to strike. Burglars often target smaller, valuable items like: cash, jewelry, laptops, guns, digital cameras, small electronics (iPods, GPS, PDA’s MP3’s and CD’s). But at ADT Choose Home Security, you aren’t alone. They are here to provide your home with the best home security equipment possible. So, let’s keep those presents safely wrapped under the tree— They will help keep them from getting checked off of a burglar’s holiday list.
 [Source: Choose Home Security]
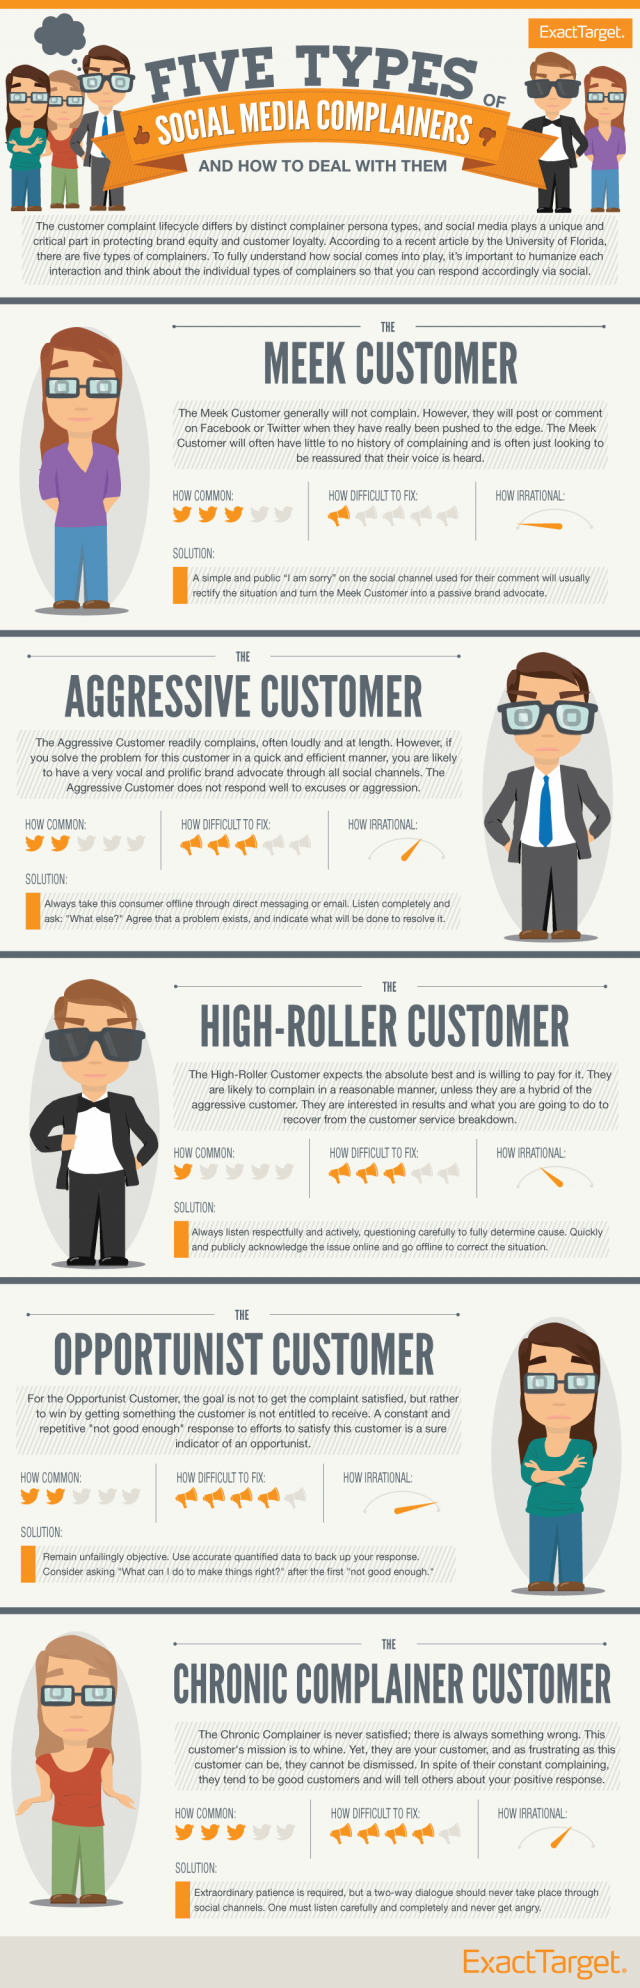
Infographic : How to Deal with Social Media Complainers
Everyone has an opinion-and when a customer is hidden behind the safety of a screen, mud can fly. No matter how hard you try to please everyone, it just won’t happen. There is, however, a simple way to identify the type of complainer you have, and an easy, clear way to deal with them. www.pardot.com has created an infographic entitled “How to Deal with Social Media Complainers ”, giving you an outline for the five types of social media complainers and how to appease them.
Infographic : Home Health Hacks
From treating stinky feet with water spiked with vodka, to curing a migraine with peppermint oil, this infographic details proven life-hacks that really work. For example, gargling salt water three times a day will cut healing time for a respiratory infection by 40%. One of life’s most irritating problems, the hiccups, can be alleviated by a simple teaspoon of sugar, as it helps relax the muscle nerves in the diaphragm. Other ailments covered in this infographic are problems such as bloating, bad breath, dry hair, and chapped lips. Who knew that such problematic ailments could be help by such simple household items?
Infographic Source :- www.cheapnursedegrees.com