Infographic : Saving on College

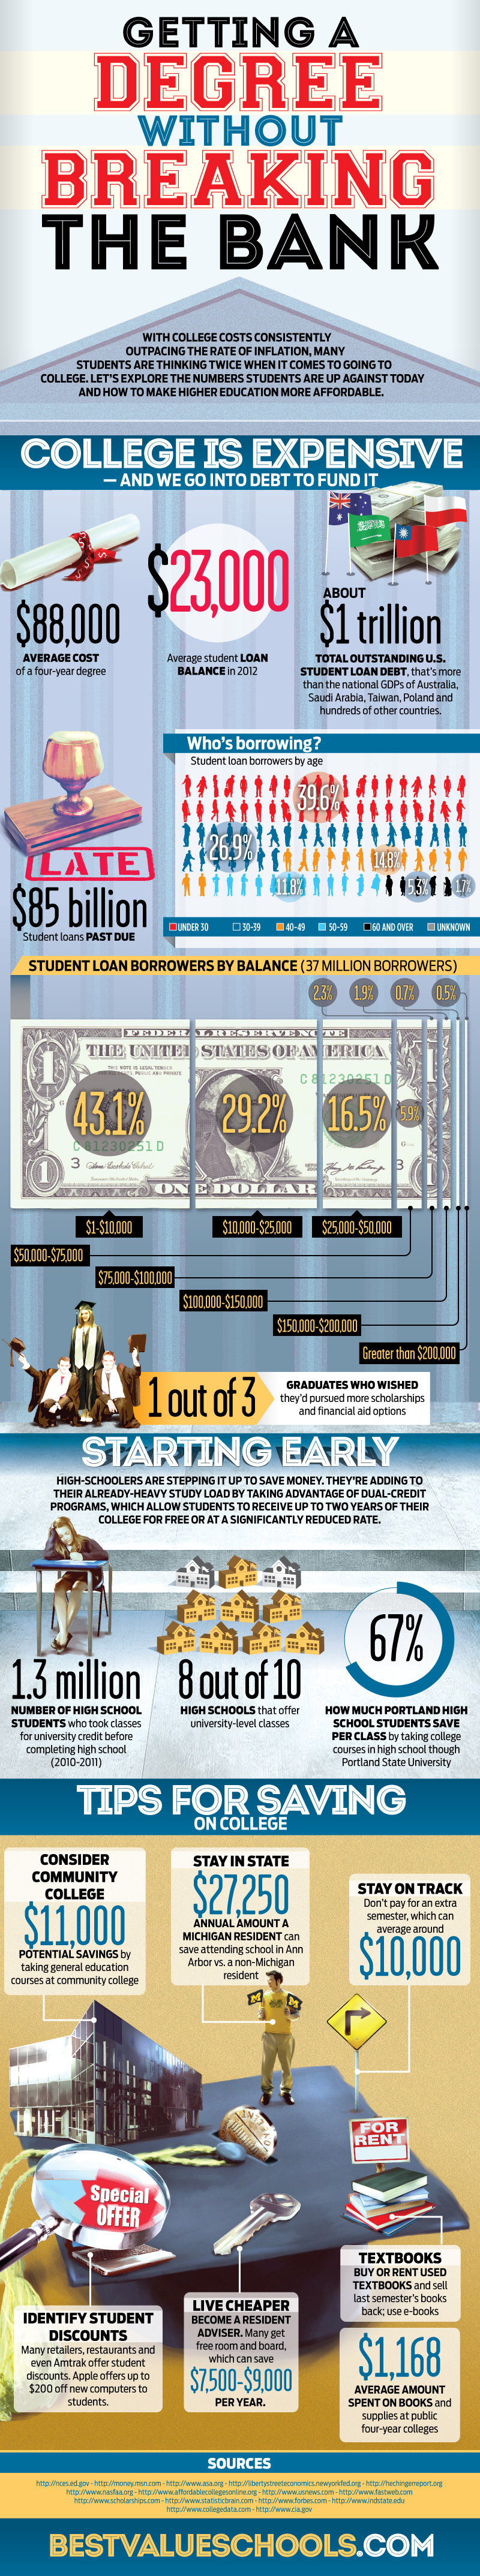
There’s no two ways about it: College is expensive.  From books and supplies to rent and tuition, students are struggling with more debt than ever before.  An average college degree costs $88,000, and leaves a student $23,000 in debt.  With $1 trillion in outstanding student loans across the nation, it’s no surprise that college enrollment is on the decline. www.bestvalueschools.com has created an infographic explaining the high costs of college, and gives you tip on how to save the most on your degree.

Infographic : Saving on College


Infographic : Evolution of Cellphones

Cell phones were first invented back in 1973,with the first cell phone available to the public being the $3,995 Motorola DynaTac in 1983.  Fast-forward to 2013, and there are 3.5 million cell phone users-including you! www.computersciencedegreehub.com has created an infographic explaining the history of the cell phone, the most popular models, and the top companies in the cell phone business.

Infographic : Evolution of Cellphones


Infographic :- Learning Disabilities

Chances are, you or someone you know has been diagnosed with some type of learning disability. It is estimated that 4-6% of the population in the United States has some type of learning disability.  While many view these individuals as lacking in intelligence, this couldn’t be further from the truth. www.special-education-degree.net has created an infographic detailing the statistics behind learning disabilities, the top five diagnosed learning disabilities, and how things we take for granted, such as an education and employment, seem to be a challenge for those with a learning disability.

Infographic :- Learning Disabilities


Infographic : Brain Trust

Scientific research and development may be a controversial subject, but www.superscholar.org has created a fact-packed infographic detailing everything you need to know about the current affairs-and the future-of scientific research and development spending, entitled “ Brain Trust ”.

The United States spends more on scientific research and development than any other country in the world.  Asia, however, spends more as a region-with 36.7% of all funds originating in the Asia region.  This is closely followed by the Americas at 36%, and Europe placing third at 24.1%.  But where does this money go?  The infographic details, by country, where that money ends up.  The United States designates their funds for national defense, health, and space/flight research.  China spends their R&D dollars in areas like nanotechnology, clean energy, stem cell research, and new labs/institutes.

Infographic : Brain Trust


Why should you choose a custom design for your business

Design – the language, which we use to tell the world about our product, solution or proposition. The success of the design at the targeted audience of the project depends on how “literately” we will build the phrase. If we try to explain it using a foreign language, then we will build the phrase totally wrong way, violating grammar rules, sentence structure, as well as interchange the keywords position, unlikely to understand us. That is to say totally won’t understand, or may understand something totally different, something we didn’t mean at all. And even can take offense.
Infographic Source :- dezayo.us
 Why should you choose a custom design for your business