Month: July 2013
Infographic: Healthcare and Social Media
Social media allows people to share their feelings and experiences, whether positive or negative. When it comes to healthcare, however, people seem guarded to disclose. 16% of individuals will post healthcare related images or videos, while 28 % post about supporting a healthcare cause.
Doctors and healthcare professionals are riding the social media wave as well. 60% of individuals say that they will trust a post buy a doctor, followed by 56% trusting nurses, and 55% trusting hospitals. 47% of people are also willing to share healthcare information with doctors through social media, and 43% willing to dish the details to hospitals via popular social media sites. Healthcare and social media are teaming up to bring doctors and patients closer than ever.
Thanks for reading “ Infographic : Healthcare and Social Media”, brought to you by Master-of-health-
Infographic:15 Fantastic Reasons to Clear Out the Clutter at Home
Infographic Source :- sparefoot.com
Infographic: The Science of Study
Your brain is a miracle. Compromised of over 90,000 miles of fibers, this thinker completes thousands of processes a second. From keeping your heart beating, to recognizing the name of a relative you haven’t seen in a few years-the brain is an amazing thing.
Infographic:Cost of Catastrophe
The financial totals for disasters in 2012 are incredible.
It’s no surprise that the best way to avoid these types of disasters is to be prepared both at home and at work. 6 in 10 businesses have no emergency response plan, and 4 in 10 homes are also unprepared. While 57% of Americans report having emergency supplies in their home, it’s important to have an emergency plan in place-no matter where you live. This infographic also details the number or natural disasters, emergency and fire protection declarations by state since 1953.
Infographic: Is Someone Listening?
Wiretapping has been around since the invention of the telephone-and the government has been listening ever since. In 1928, the Supreme Court approved of wiretapping, along with using the recorded conversations as evidence. In 1945 the government takes it a step further by receiving microfilm copies of every telegram that enters and leaves the country-known as project Shamrock. In 1967, the Supreme Court overturned the 1945 ruling, and in 1968 a federal law restricts wiretapping. Shortly after Watergate, the government shuts down the Shamrock project.
Infographic: The Truth about 100% Compensation
This infographic seeks to educate the public of the impact that changes in UK legislation on 1st of April 2013 will have on how much compensation successful personal injury claimants can receive, as they are no longer allowed 100%.
Via:- expresssolicitors.com
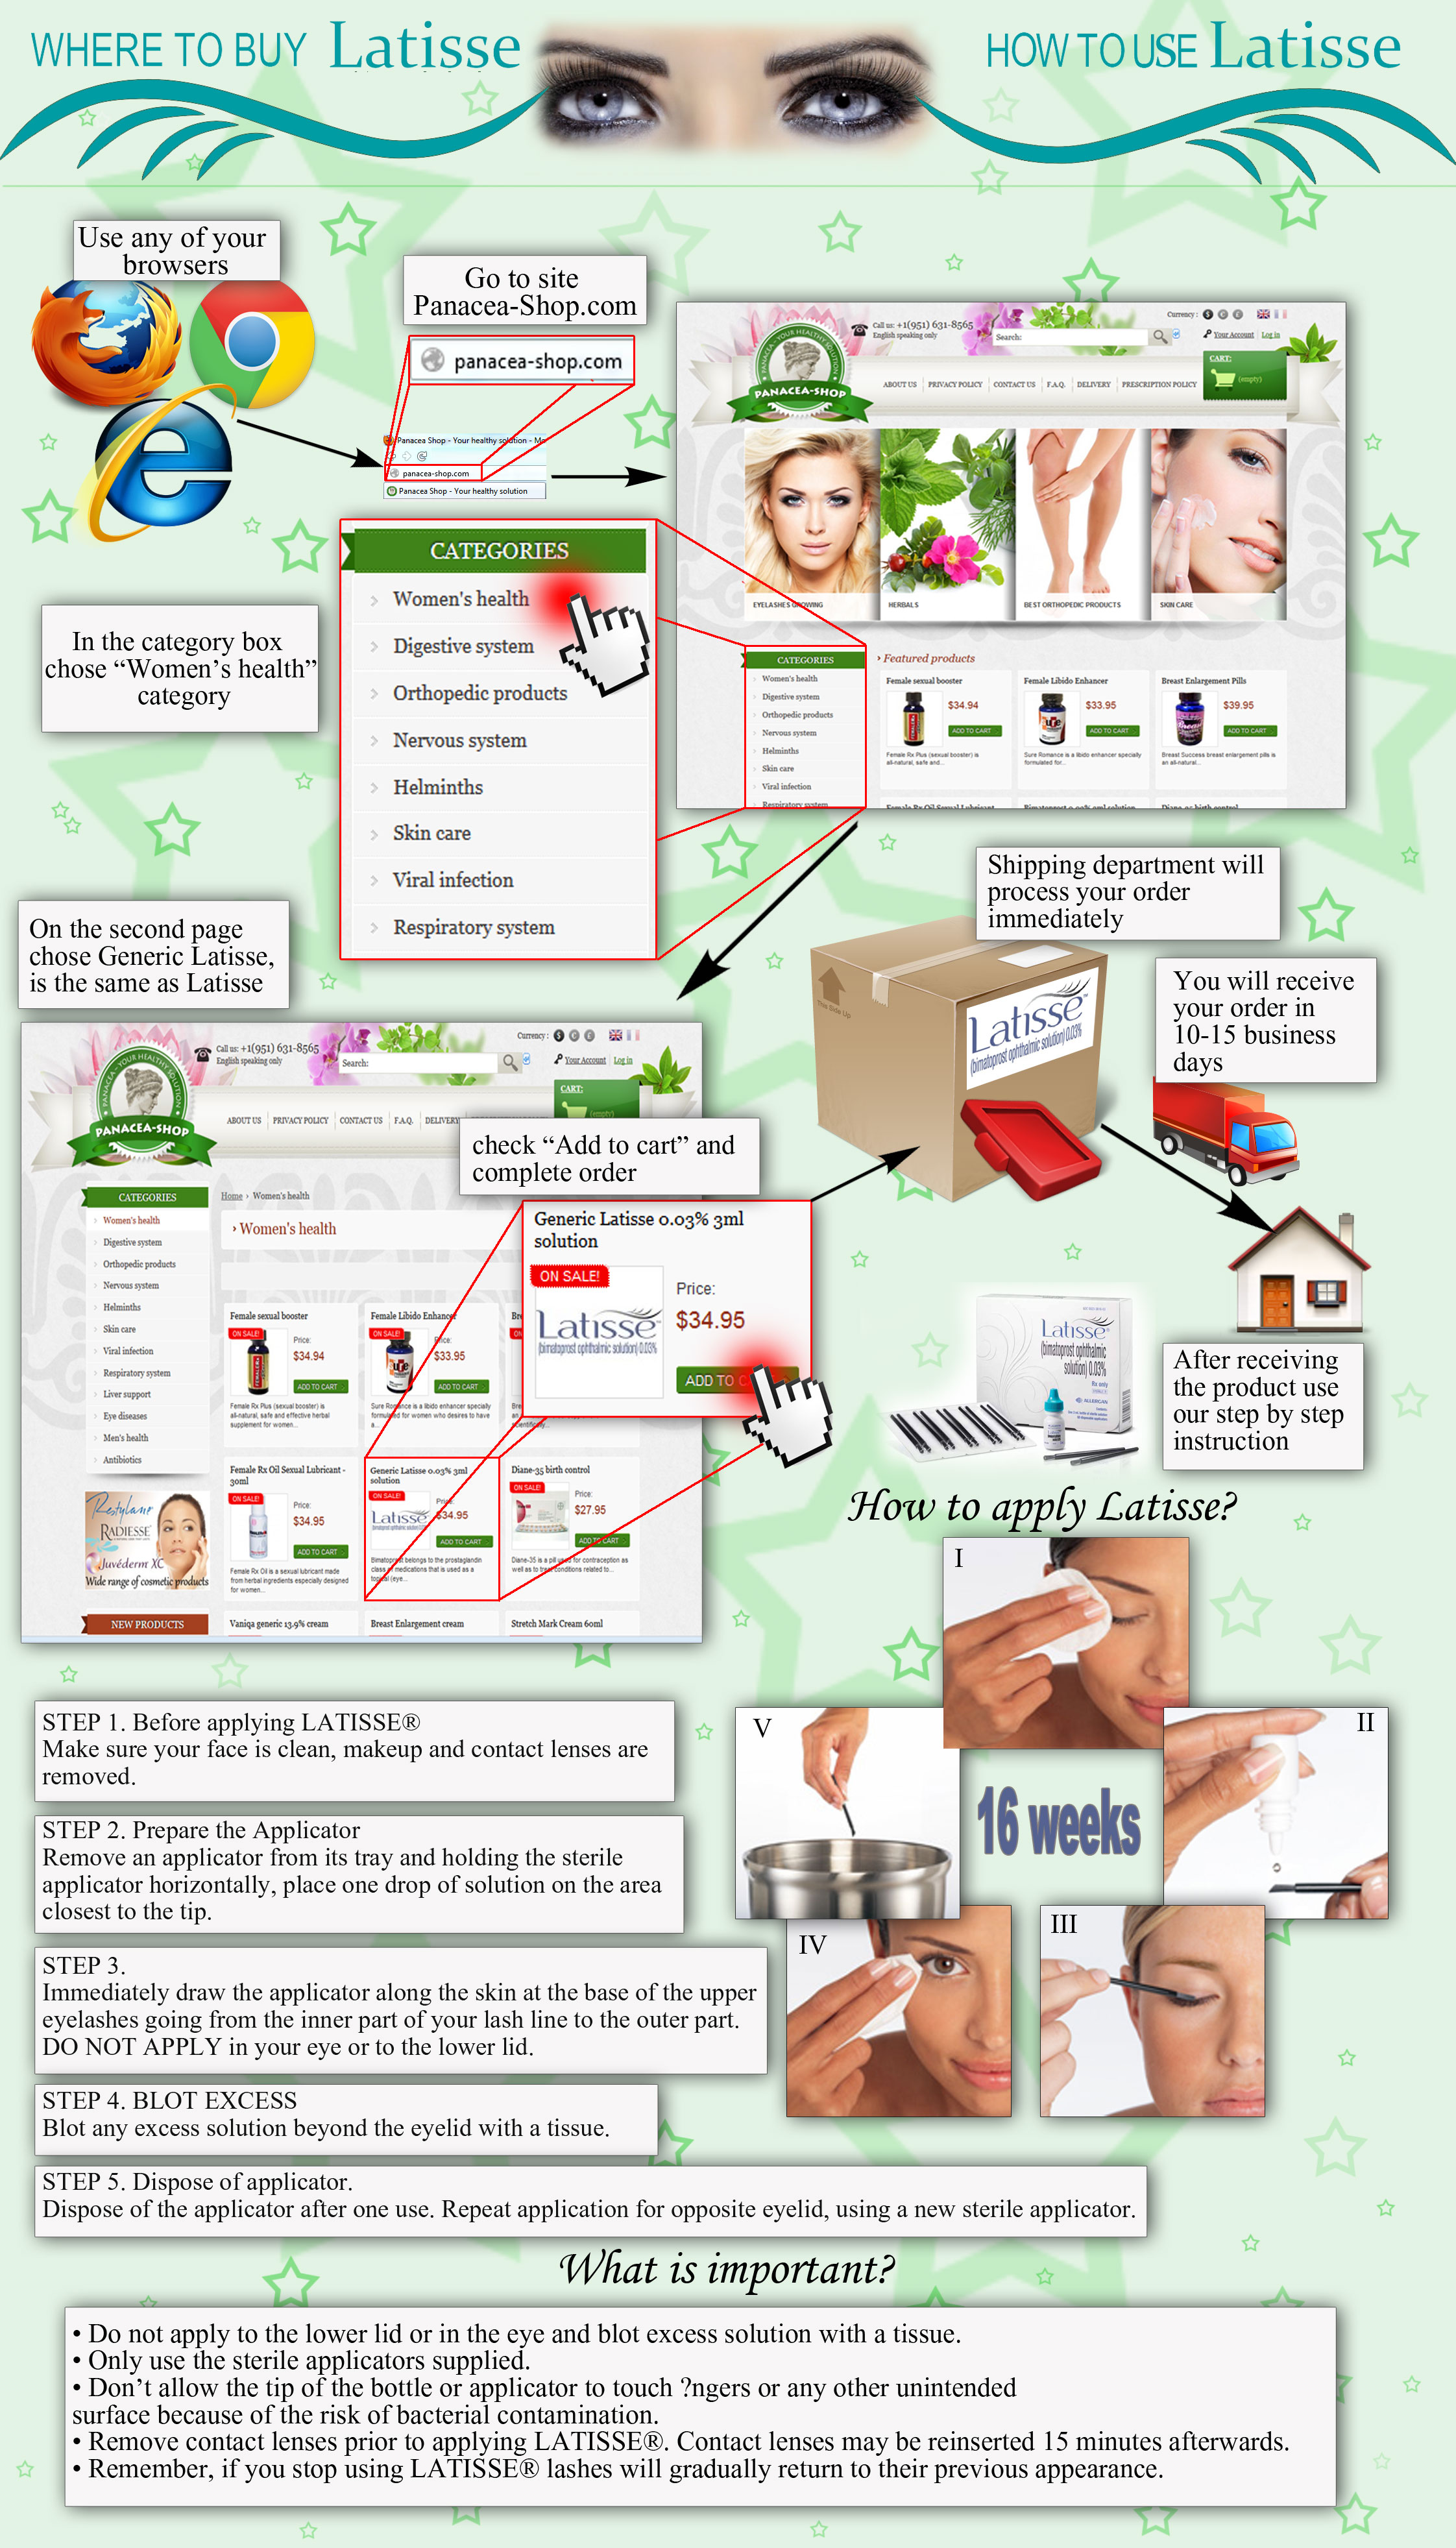
Infographic :How to grow long eyelashes
Latisse is a cosmetic product used for eyelashes growth. Find out how to apply Latisse solution on your upper eyelashes. Follow panacea-shop.com step by step instruction, read general recommendations, and other important information needed to use the product in a proper manner.
Infographic:The Life and Death of the U.S. Auto Industry
1916 saw a huge change in America-the passing of the Federal Aid Road Act. This act provided $75 million of Federal money in 50/50 matching funds to the states; up to 6% of the roads statewide over a 5 year period. Less than one year later, every state would have a Highway Agency to assist in managing the funds. In 1924, Henry Ford debuted his family friendly Model-A vehicle, with a price tag of $260. This price would be equivalent of around $10,000 today.
Source:- bizbrain.org
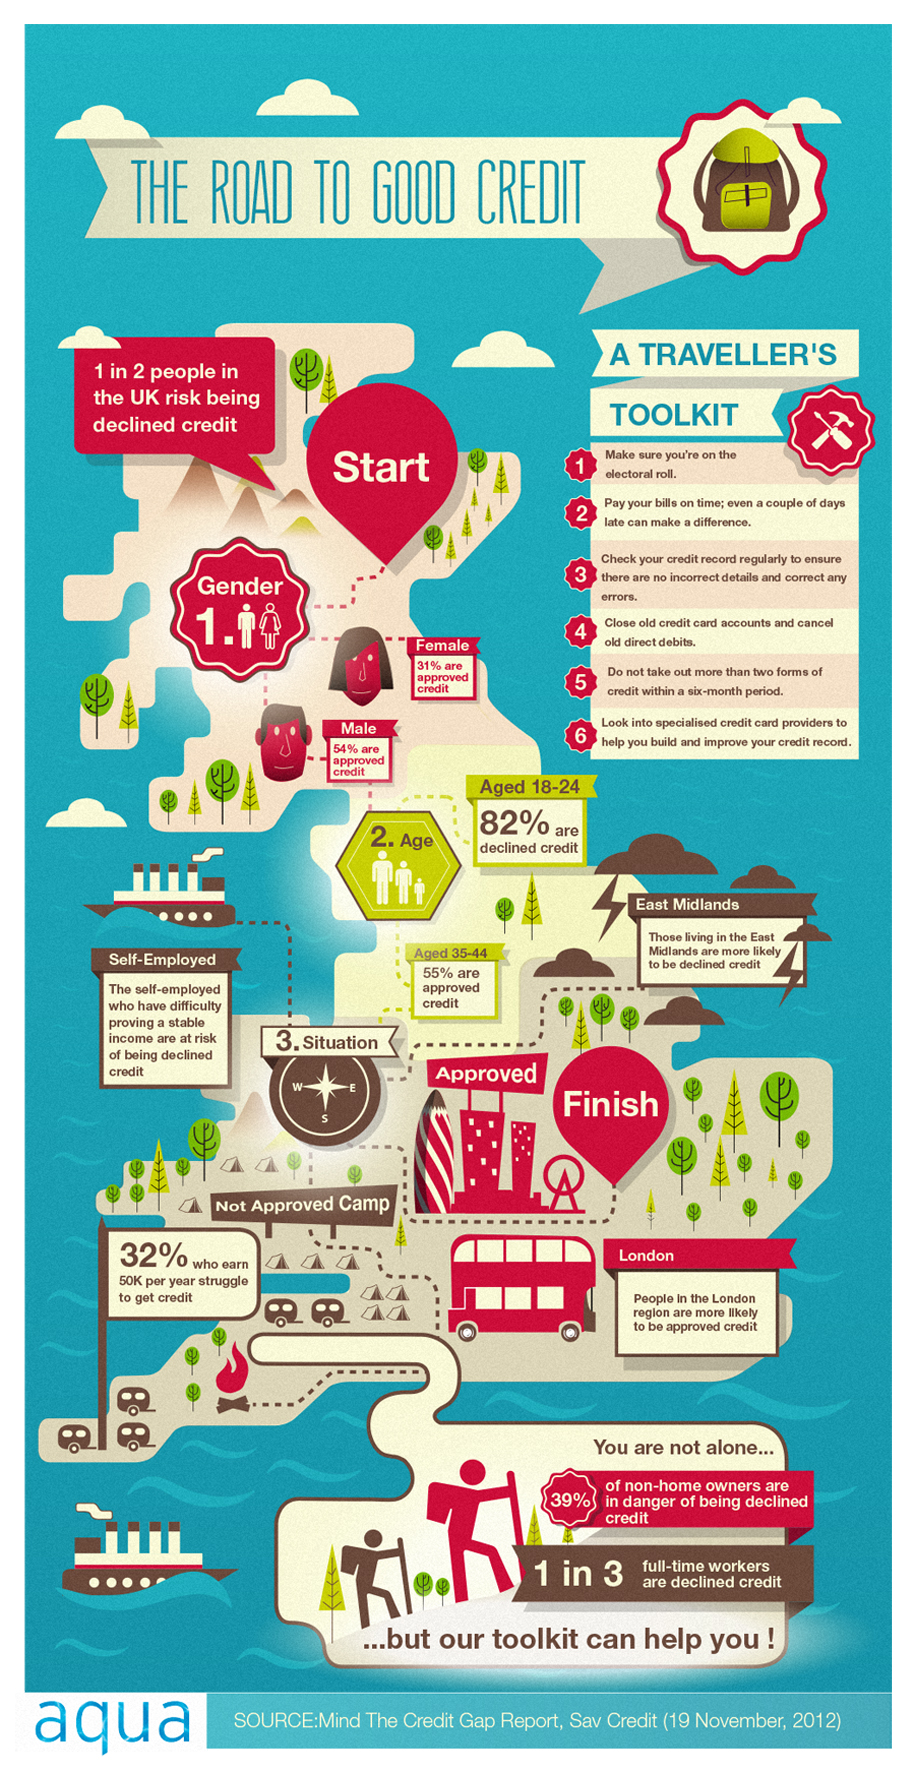
Infographic :The Road To Good Credit
Are You On ‘The Road To Good Credit’?What is the secret behind good credit? At a time where more than half (57%) of UK customers are at risk of being declined credit by high-street lenders, it’s helpful to know if we’re on ‘The Road To Good Credit’.Creditworthiness varies by gender, age and where you live. Other personal circumstances also play a role in determining whether you’ll be approved for credit. Key research findings from the Mind the Credit Gap Report of 2012 show that people from all walks of life find getting credit difficult:- 34% of people in full-time employment often find it hard to access credit- Of those earning £50,000, 32% struggle to get credit- 82% of 18-24-year-olds don’t meet standard lending criteria- 7 in 10 people don’t know their credit scoreIt can be challenging to maintain good credit, however with aquacard’s useful ‘Traveller’s Toolkit’ you can get back on track.
aquacard helps people who have had bad credit and provides them with specialist credit cards that help to slowly rebuild their reputation and strengthen their credit card rating. For more information visit our infographic here: http://www.aquacard.co.uk/credit-tips-advice/credit-score/infographic-the-road-to-good-credit


